
In this guide
Your next steps
- Choose the peer group before checking the gap.
- State whether the average is pooled or equal-weighted.
- Align time basis and business context.
- Use the gap to choose an investigation, not a causal claim.
An account average is not a control group
An ad can beat account-average ROAS because the account mixes products, warm audiences and old campaigns. First ask what reference you need: combined delivered exposure, a typical eligible ad, or similar ads selling the same product.
1. Name the averaging method
Pooled CTR divides total clicks by total impressions. An equal-weighted per-ad average calculates each eligible ad’s CTR and averages those rates. One weights delivery; the other gives each ad equal influence.
Both calculations below are correct. They answer different questions, so do not switch methods between reviews without saying so.
| Ad / calculation | Impressions | Clicks | CTR |
|---|---|---|---|
| Small-delivery ad | 1,000 | 40 | 4.00% |
| Large-delivery ad | 99,000 | 990 | 1.00% |
| Pooled: 1,030 ÷ 100,000 | 100,000 | 1,030 | 1.03% |
| Equal weight: (4% + 1%) ÷ 2 | — | — | 2.50% |
2. Define eligible peers
Start with the same objective and conversion location. Then consider audience temperature, product economics, geography, placement and offer. Require mature evidence without restricting the pool to surviving winners.
- Keep metric, attribution and currency definitions consistent.
- Record maturity rules and the actual peer list.
- State whether the selected ad is included; inclusion pulls the reference toward itself.
- Separate prospecting and remarketing when the decision needs that distinction.
3. Check time, budget and product context
Same-window comparisons share calendar conditions but may contain little evidence for some ads. Lifetime comparisons help when ads ran at different times, while potentially mixing seasons, offers and audience saturation.
A small remarketing ad and a large prospecting ad have different assignments. Higher order value can lift ROAS without improving purchase rate. Account membership alone does not neutralize budget, price or margin differences.
4. Show the gap and its limitations
Purchase rate of 0.06% versus 0.04% is a 0.02 percentage-point gap and a 50% relative difference. With few purchases, that large relative lift can be unstable.
The benchmark is estimated too. A test treating it as a fixed reference is conditional on that choice and does not capture every source of peer variation. A changing audience or product mix can move the average even when within-group performance is stable.
Review account peers in scale190
The reviewed general-comparison implementation displays arithmetic means of eligible ads’ metrics rather than pooled ratios dominated by delivery. Readiness filters apply to peers, with stricter subject checks in the analytical comparison workflow.
That workflow uses available lifetime evidence, not one shared date window. It does not automatically match every peer on price, margin or audience temperature. Distinguish descriptive cards from completed analytical comparisons and read their evidence context.
Save the selected ad, peer definition, time basis, averaging method and next action. If the reference moves, check whether the peer group changed before assuming the ad deteriorated.
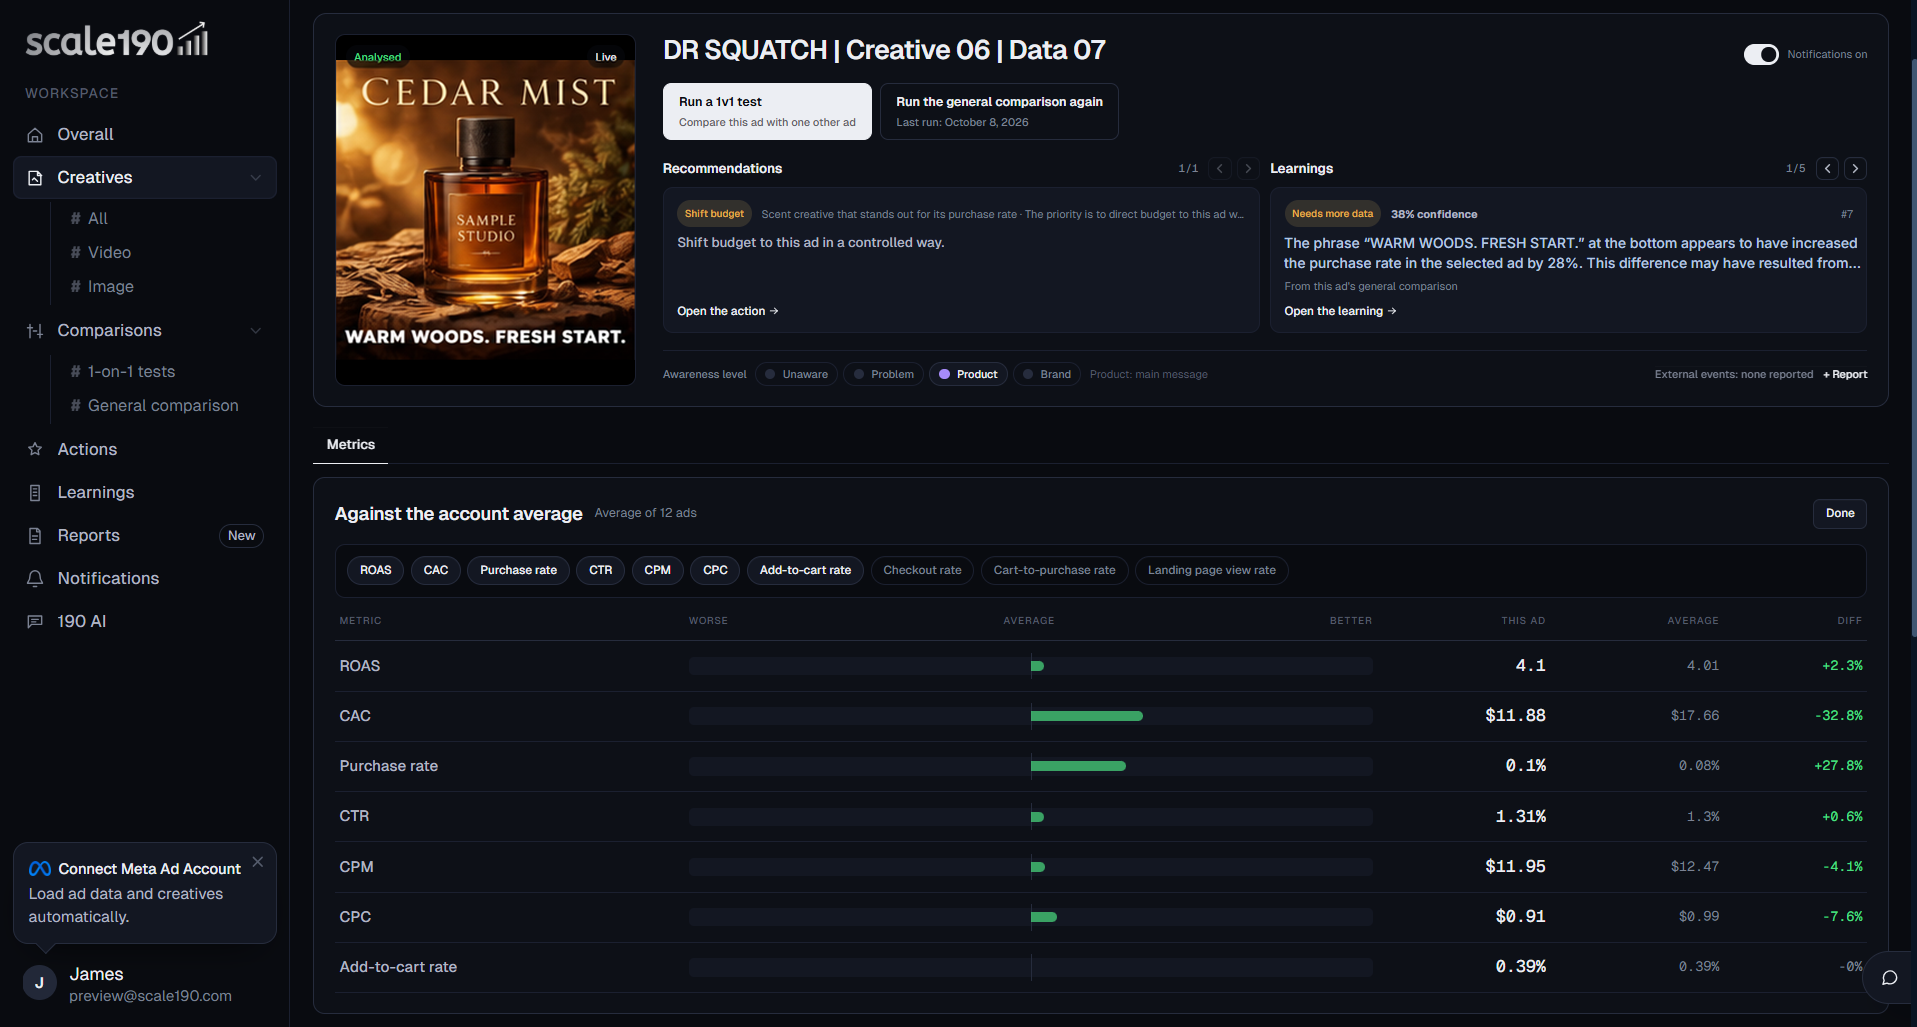
Illustrative example. The profile, creative images and learning copy have been edited; the displayed metrics explain the interface and are not verified results for the fictional creative.
Open full-size screenshotSources & further reading
Worked examples are hypothetical. References provide further methodological background.
- NIST: testing a proportion against a referenceFixed-reference inference depends on model and sample assumptions.
- NIST: planning sample size for proportionsThe effect of interest changes the evidence requirement.