
In this guide
Your next steps
- Confirm the outcome and metric definitions.
- Read attention, purchases and economics together.
- Check volume and a comparable benchmark.
- Turn disagreements into a focused next test.
High CTR does not always mean strong sales
One ad wins on clicks, another on purchase CPA. Start with the business question rather than the most flattering number. Audience, auction, offer and landing experience all contribute to the observed result.
1. Keep the definitions consistent
Choose a click definition: all clicks, link clicks and outbound clicks answer different questions. Align the observation period, event source and attribution settings before comparing ads.
In this guide and scale190 creative analysis, purchase rate means purchases divided by impressions. Purchases divided by link clicks is a different, post-click rate. Never swap the denominators silently.
2. Read a complete set of outcomes
These hypothetical ads have equal impressions and $50 average order value. A attracts more clicks; B produces more purchases and better reported economics despite spending more. Choosing on CTR alone would miss that distinction.
The table is descriptive arithmetic, not causal or statistical proof. Check delivery conditions and uncertainty before deciding that the creative explains the difference.
| Metric | Ad A | Ad B |
|---|---|---|
| Impressions | 100,000 | 100,000 |
| Link clicks | 1,500 | 900 |
| Purchases | 50 | 70 |
| Spend | $1,000 | $1,200 |
| Purchase value | $2,500 | $3,500 |
| Link CTR | 1.50% | 0.90% |
| Purchase rate | 0.05% | 0.07% |
| Cost per purchase | $20.00 | $17.14 |
| ROAS | 2.50x | 2.92x |
3. Ask whether the evidence is mature
Show event counts and denominators beside rates. Three purchases make a fragile estimate even with many impressions. Review complete days and allow conversion delay.
Use an appropriate interval or test where the assumptions fit. Sparse outcomes, repeated exposure and missing tracking limit what a precise-looking score can tell you.
4. Diagnose before making a creative judgment
Compare similar objectives and conversion locations. Separate prospecting, remarketing and different product economics where relevant. A pooled account rate and the average eligible ad’s rate are different references.
High CTR with weak purchases suggests investigating traffic quality or an offer mismatch. Rising CPM may worsen CPA while response is stable. These are questions to check, not automatic diagnoses. Change one plausible cause in the next test.
Keep the ad beside its evidence in scale190
Creatives brings imported image or video ads together with performance metrics. Creative analysis describes content; comparisons add another ad or an account peer reference.
Review the actual media, definitions, volume and comparison quality together. AI observations can help form a hypothesis, but they do not prove causation. A useful next-test idea can remain tentative.
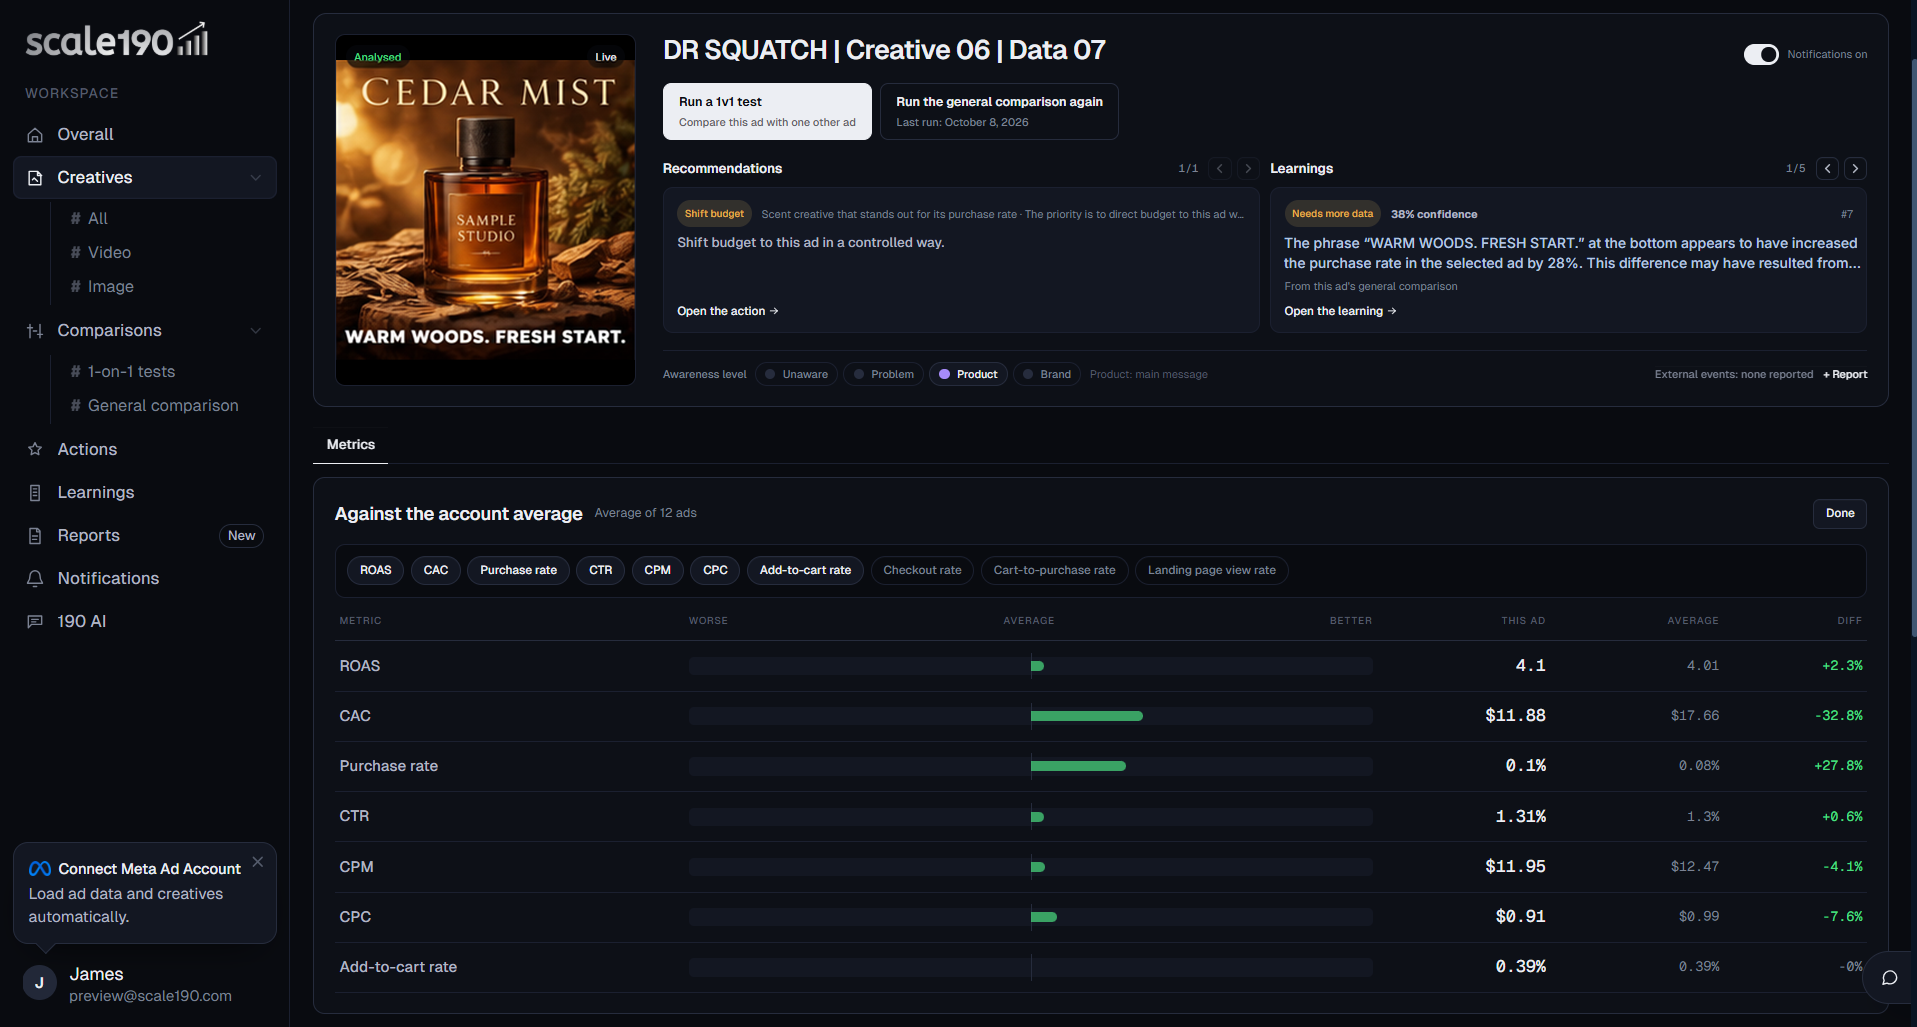
Illustrative example. The profile, creative images and learning copy have been edited; the displayed metrics explain the interface and are not verified results for the fictional creative.
Open full-size screenshotSources & further reading
Worked examples are hypothetical. References provide further methodological background.
- NIST: confidence intervals for proportionsInterval estimation and limitations of simple symmetric intervals.
- Penn State: inference for two independent proportionsAssumptions and event-count requirements for common tests.